Using the app size tool
What is it?
The app size tool allows you to analyze the total size of your app. You can view a single snapshot of “size information” using the Analysis tab, or compare two different snapshots of “size information” using the Diff tab.
What is “size information”?
“Size information” contains size data for Dart code, native code, and non-code elements of your app, like the application package, assets and fonts. A “size information” file contains data for the total picture of your application size.
Dart size information
The Dart AOT compiler performs tree-shaking on your code when compiling your application (profile or release mode only—the AOT compiler is not used for debug builds, which are JIT compiled). This means that the compiler attempts to optimize your app’s size by removing pieces of code that are unused or unreachable.
After the compiler optimizes your code as much as it can, the end result can be summarized as the collection of packages, libraries, classes, and functions that exist in the binary output, along with their size in bytes. This is the Dart portion of “size information” we can analyze in the app size tool to further optimize Dart code and track down size issues.
How to use it
If DevTools is already connected to a running application, navigate to the “App Size” tab.

If DevTools is not connected to a running application, you can access the tool from the landing page that appears once you have launched DevTools (see installation instructions).

Analysis tab
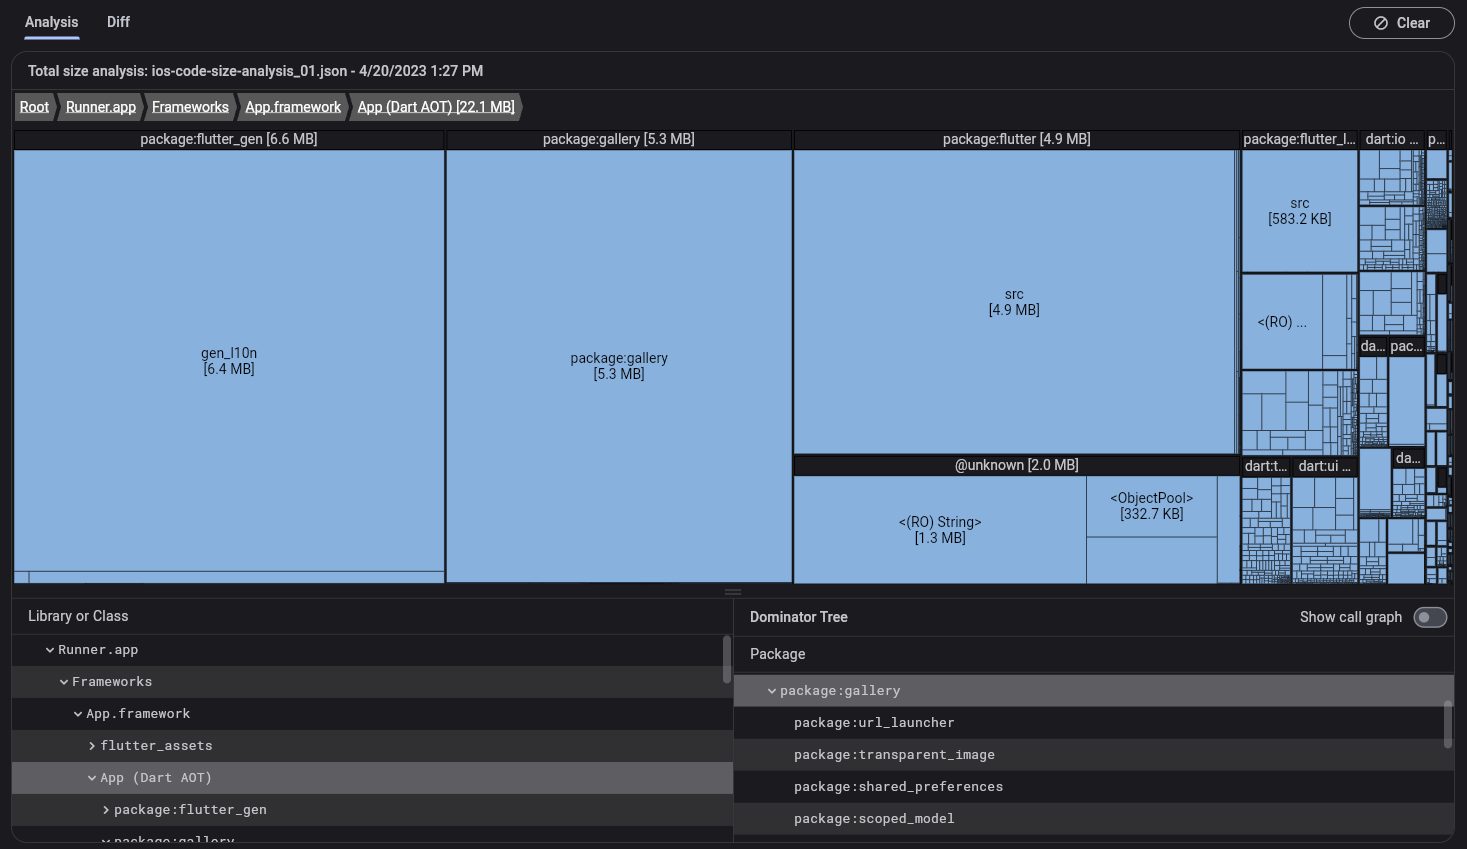
The analysis tab allows you to inspect a single snapshot of size information. You can view the hierarchical structure of the size data using the treemap and table, and you can view code attribution data (for example, why a piece of code is included in your compiled application) using the dominator tree and call graph.

Loading a size file
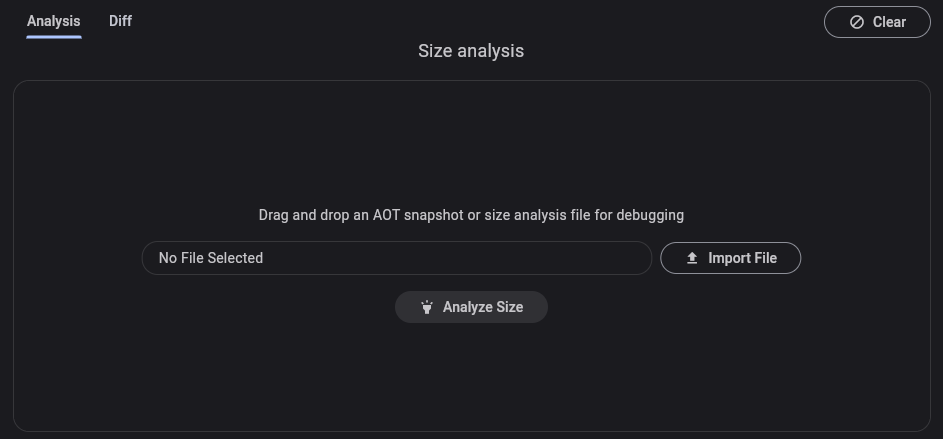
When you open the Analysis tab, you’ll see instructions to load an app size file. Drag and drop an app size file into the dialog, and click “Analyze Size”.

See Generating size files below for information on generating size files.
Treemap and table
The treemap and table show the hierarchical data for your app’s size.
Using the treemap
A treemap is a visualization for hierarchical data. The space is broken up into rectangles, where each rectangle is sized and ordered by some quantitative variable (in this case, size in bytes). The area of each rectangle is proportional to the size the node occupies in the compiled application. Inside of each rectangle (call one A), there are additional rectangles that exist one level deeper in the data hierarchy (children of A).
To drill into a cell in the treemap, select the cell. This re-roots the tree so that the selected cell becomes the visual root of the treemap.
To navigate back, or up a level, use the breadcrumb navigator at the top of the treemap.

Dominator tree and call graph
This section of the page shows code size attribution data (for example, why a piece of code is included in your compiled application). This data is visible in the form of a dominator tree as well as a call graph.
Using the dominator tree
A dominator tree is a tree where each node’s
children are those nodes it immediately dominates.
A node a is said to “dominate” a node b if
every path to b must go through a.
To put it in context of app size analysis,
imagine package:a imports both package:b and package:c,
and both package:b and package:c import package:d.
package:a
|__ package:b
|   |__ package:d
|__ package:c
    |__ package:d
In this example, package:a dominates package:d,
so the dominator tree for this data would look like:
package:a
|__ package:b
|__ package:c
|__ package:d
This information is helpful for understanding why certain pieces of code are present in your compiled application. For example, if you are analyzing your app size and find an unexpected package included in your compiled app, you can use the dominator tree to trace the package to its root source.

Using the call graph
A call graph provides similar information to the dominator tree in regards to helping you understand why code exists in a compiled application. However, instead of showing the one-to-many dominant relationships between nodes of code size data like the dominator tree, the call graph shows the many-to-many relationships that existing between nodes of code size data.
Again, using the following example:
package:a
|__ package:b
|   |__ package:d
|__ package:c
    |__ package:d
The call graph for this data would link package:d
to its direct callers, package:b and package:c,
instead of its “dominator”, package:a.
package:a --> package:b -->
                              package:d
package:a --> package:c -->
This information is useful for understanding the fine-grained dependencies of between pieces of your code (packages, libraries, classes, functions).

Should I use the dominator tree or the call graph?
Use the dominator tree if you want to understand the root cause for why a piece of code is included in your application. Use the call graph if you want to understand all the call paths to and from a piece of code.
A dominator tree is an analysis or slice of call graph data, where nodes are connected by “dominance” instead of parent-child hierarchy. In the case where a parent node dominates a child, the relationship in the call graph and the dominator tree would be identical, but this is not always the case.
In the scenario where the call graph is complete
(an edge exists between every pair of nodes),
the dominator tree would show the that root is the
dominator for every node in the graph.
This is an example where the call graph would give
you a better understanding around why a piece of code is
included in your application.
Diff tab
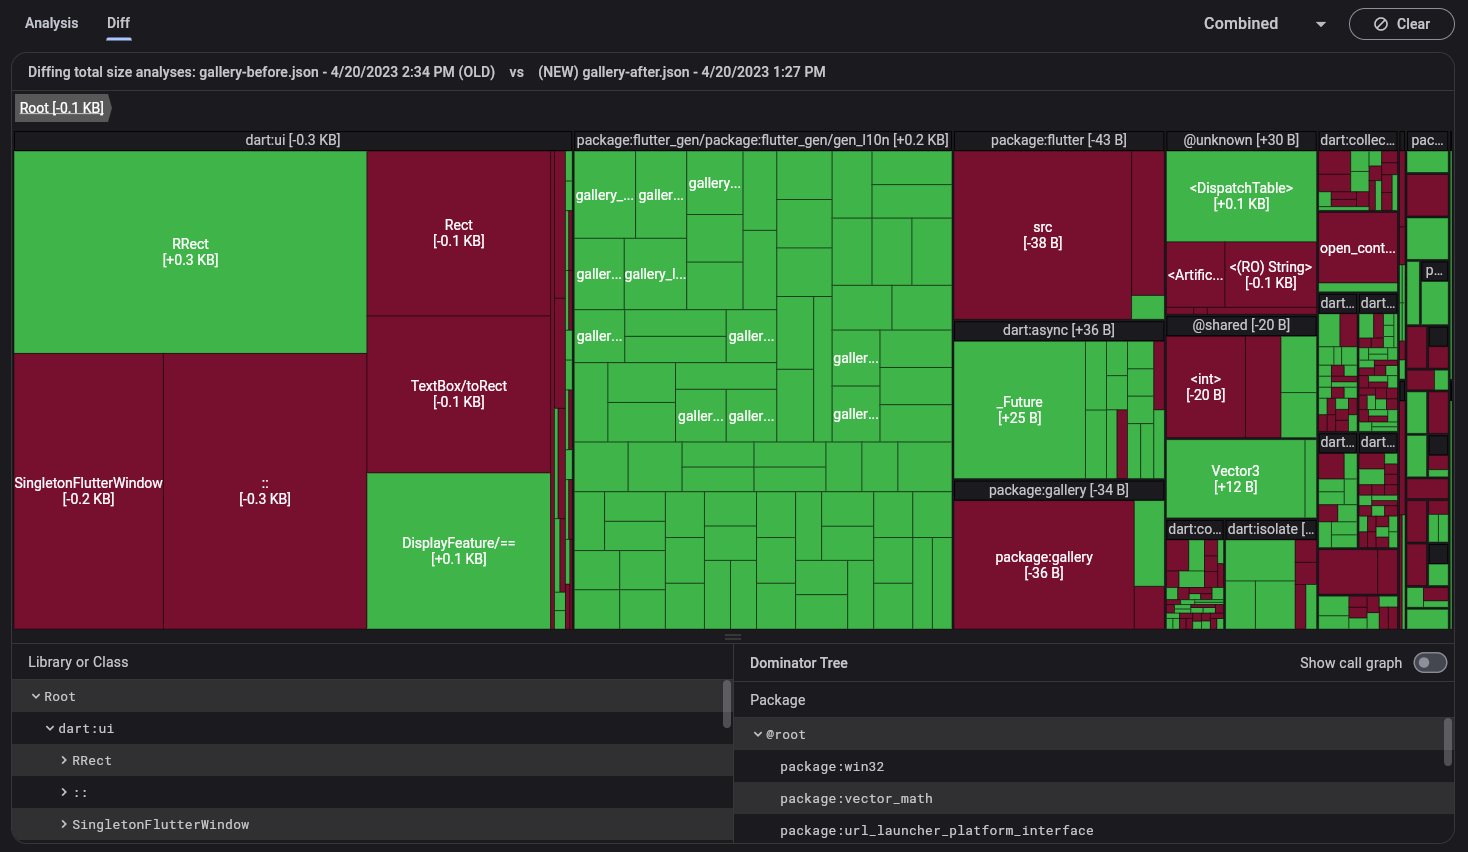
The diff tab allows you to compare two snapshots of size information. The two size information files you are comparing should be generated from two different versions of the same app; for example, the size file generated before and after changes to your code. You can visualize the difference between the two data sets using the treemap and table.

Loading size files
When you open the Diff tab, you’ll see instructions to load “old” and “new” size files. Again, these files need to be generated from the same application. Drag and drop these files into their respective dialogs, and click Analyze Diff.

See Generating size files below for information on generating these files.
Treemap and table
In the diff view, the treemap and tree table show only data that differs between the two imported size files.
For questions about using the treemap, see Using the treemap above.
Generating size files
To use the app size tool, you’ll need to generate a
Flutter size analysis file. This file contains size
information for your entire application (native code,
Dart code, assets, fonts, etc.), and you can generate it using the
--analyze-size flag:
flutter build <your target platform> --analyze-size
This builds your application, prints a size summary to the command line, and prints a line telling you where to find the size analysis file.
flutter build apk --analyze-size --target-platform=android-arm64
...
▒▒▒▒▒▒▒▒▒▒▒▒▒▒▒▒▒▒▒▒▒▒▒▒▒▒▒▒▒▒▒▒▒▒▒▒▒▒▒▒▒▒▒▒▒▒▒▒▒▒▒▒▒▒▒▒▒▒▒▒▒▒▒▒▒▒▒▒▒
app-release.apk (total compressed)                               6 MB
...
▒▒▒▒▒▒▒▒▒▒▒▒▒▒▒▒▒▒▒▒▒▒▒▒▒▒▒▒▒▒▒▒▒▒▒▒▒▒▒▒▒▒▒▒▒▒▒▒▒▒▒▒▒▒▒▒▒▒▒▒▒▒▒▒▒▒▒▒▒
A summary of your APK analysis can be found at: build/apk-code-size-analysis_01.json
In this example, import the build/apk-code-size-analysis_01.json
file into the app size tool to analyze further.
For more information, see App Size Documentation.
Other resources
To learn how to perform a step-by-step size analysis of the Wonderous App using DevTools, check out the App Size Tool tutorial. Various strategies to reduce an app’s size are also discussed.